The Digital Archaeological Atlas of the Holy Land
A Regional Approach to Archaeology on the Madaba Plain: Random Survey and Settlement Patterns
By Gary L. Christopherson
The University of Arizona
Presented at the Annual Meetings of the
American Schools of Oriental Research
November, 1997
Napa, California
Abstract
From its inception, the Madaba Plains Project has included hinterland surveys in its research design. This emphasis on a regional approach has led to the collection of a broad range of environmental and archaeological data for the regions of Tall Hisban, Tall al-Umayri, and Tall Jalul. As an example of the types of research being conducted, this paper focuses on the random sample survey in the vicinity of Tall Hisban. In order to document, understand, and reconcile contradictory settlement pattern data, this study uses a GIS to constructs trend surfaces representing settlement in the region. These surfaces suggest that antiquity sites remain under-represented in large parts of the Tall Hisban Hinterland.
Introduction

Figure 1. The early surveys around Tall Hisban
The Tall Hisban Survey
Located at 226700E, 134400N on the Palestine grid, Tall Hesban sits on the edge of the slopes that descend from the Madaba Plain to the Jordan Valley. A major archaeological excavation and survey were carried out at Tall Hisban during the 1970's. (Boraas & Geraty, 1976; Boraas & Geraty, 1978; Boraas & Horn, 1973; Boraas & Horn, 1975; Geraty, 1975; Geraty, 1976) The archaeological survey was conducted by Robert Ibach and recorded 148 sites in the vicinity of Tall Hisban. A series of preliminary reports (Ibach, 1976; Ibach, 1978a; Ibach, 1978b) and a final publication volume (Ibach, 1987) for this survey have provided a wealth of archaeological information about the Tall Hisban region. In addition to the archaeological survey, environmental and ethnographic surveys were carried out in the region by specialists under the direction of Øystein LaBianca (Geraty & LaBianca, 1985; LaBianca, 1990; LaBianca & Lacelle, 1986).
Thanks to the support of the Madaba Plains Project, and a National Geographic Society research grant, survey teams returned to the Hisban region in 1996 and 1997. The decision to return to was based two perceived deficiencies in the data. The first of these was the lack of a random sample from the region. The random surveys in the Tall Jalul and Tall al-Umayri regions had been very successful, and it was hoped that a similar survey of the Hisban region would provide the same kinds of archaeological and environmental data. The second deficiency was the contradictory boundaries of the original surveys. In a number of publications, the stated area of the survey was a ten kilometer radius around Tall Hisban (Boraas & Geraty, 1976: 5; Boraas & Geraty, 1978: 13; Boraas & Horn, 1975: 115; Geraty, 1975: 49; Geraty, 1976: 50; Ibach, 1976: 119; Ibach, 1978a: 201; LaBianca, 1984: 269, 273; LaBianca, 1990: 27); however, the archaeological survey found this boundary "impractical" and substituted others during the course of their work, shrinking and expanding the boundary according to the dictates of changing working conditions and research goals (Ibach, 1987: 5). Later, ethnographic and environmental data were collected within the ten kilometer radius (LaBianca, 1990: 27; LaBianca & Lacelle, 1986: 3). This left investigators with two, partially coincidental regions (Figure 2). Standing by themselves each survey was exemplary but because their boundaries did not match, attempts to integrate long-term environmental structures with settlement patterns in the Hesban region has proven problematic.
Wanting to correct these deficiencies, but not wishing to repeat Ibach and LaBianca's work, the 1996-97 project reduced the survey area to a five kilometer radius around Tall Hisban and introduced a random sample methodology (Figure 3). This had the effect of side-stepping the mismatched survey boundaries, and allowed investigators the luxury of utilizing Ibach's pre-existent archaeological database, and a wealth of ethnographic and environmental data collected by LaBianca, and others.

Figure 2. The new surveys around Tall Hisban

Figure 3. The random square survey area around Tall Hisban

Figure 4. Random squares surveyed around Tall Hisban
Recording a random square begins by accurately locating it on the ground. Using the coordinates for the SW corner of each random square, a global positioning system, or GPS, was used to navigate to this point (2). Starting from this corner, and using a magnetic compass, the recorder paced off each side of the square, noting the position of various local landmarks, e.g. roads, walls, fences, buildings, etc.. Once the boundary of the square had been determined, the investigator made a sketch map of the square and completed the data recording sheet. While the recorder was engaged in these tasks, the other members of the survey team would systematically collect pottery sherds from the square for two person hours. Following the collection of pottery, team members searched for archaeological sites in the vicinity of the random square. (Herr & Christopherson, 1998)
Contradictory Settlement Patterns in the Hisban Region
As investigators worked their way through the 100 random squares, data which seemed to support two contradictory settlement patterns began to emerge. The first pattern was based on archaeological sites in the region. There were 95 recorded sites within the 5 kilometer radius, 65 from Ibach's survey and 30 sites discovered during course of the random square survey. From these, it was clear that archaeological sites were found predominantly to the north and west. The second source of data was the pottery collected from the random squares. It appeared to investigators in the field that random squares to the south and east were producing the most pottery. If it is assumed that there is a correlation between ceramic remains and ancient settlement, this data suggested that settlement was concentrated in the southeast of the project region.
Trend Surfaces and Settlement Patterns
In order to test these observations, trend surface models were constructed in Arc/Info, a workstation GIS (3). Trend surfaces use a regression of polynomials taken from x, y coordinate pairs to discover spatial trends in data. The simplest of these surfaces, first order, fit a least squares plane to a project area. This plane rises in the direction in which the trend is strongest. More complicated trend surfaces bend to fit the data more closely. A second order surface bends once, third order twice, and so on. (Davis, 1986; Monroe, Feder, Foirier, & Gradie, 1980)
Trend surfaces come in two varieties, logistic and linear. Logistic trend surfaces are based on a regression which compares the x, y coordinate pairs at points of interest to coordinate pairs of a random sample of points in the same region. Linear trend surfaces are calculated based on a regression of x, y coordinate pairs and a z value assigned to those pairs (Computing Resource Center, 1992). Creating trend surface models for this report utilized both types of regression; logistic to create models based on the location of known archaeological sites, and linear to create models based on the total weight of pottery collected from each random square. Calculation for each was done in the raster module of Arc/Info, using th ecommand TREND (ESRI, 1995).
First order surfaces confirmed the suspicions of the investigators. Comparing the locations of known archaeological sites to the locations of 250 randomly located points in the Hisban region, a first order trend surface was created. This surface can be seen in Figure 5, where blues represented low probability and yellows high probability. (Higher probability scores indicate the model's prediction of wheere sites were most likely to be found). As expected, probability scores were highest in the northwest, and lowest in the southeast, corresponding to the location of archaeological sites in the region.

Figure 5. First-order trend surface around Tall Hisban
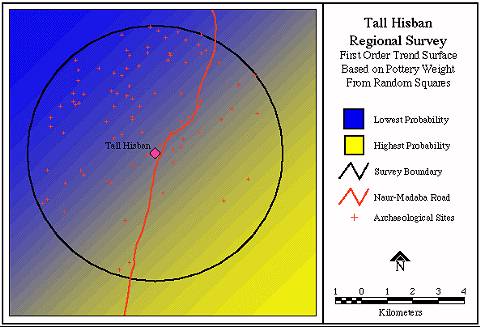
Figure 6. First-order trend surface, based on weight of pottery collected around Tall Hisban
For comparison, a first order linear trend surface based on the weight of pottery collected from each random square was also created . This model can be seen in Figure 6. Again blues are low probability and yellows are high probability. In this model the trend ran counter to that of the model based on sites. Probability scores were now highest in the southeast and lowest in the northwest. Again, if a correlation is assumed between pottery and archaeological sites, this model suggested that ancient settlement would have been concentrated in the southeast.
In order to better describe the trends, these same data were used to create third order models for the region. With their ability to bend twice, these models provided further definition of the divergent trends seen in the first order models. The third order model based on known archaeological sites can be seen in Figure 7. Clearly a better fit than the first order surface, this model showed a circular area to the northwest of Tall Hisban where probability scores were highest. This zone of yellow corresponded to large cluster of archaeological sites.

Figure 7. Third-order trend surface, based on known sites around Tall Hisban

Figure 8. Third-order trend surface, based on pottery collected from random squares around Tall Hisban
Contrast this with Figure 8, which shows the third order model based on pottery collected from random squares. In contrast to the model based on sites, the zone of highest probability for this model was defined by a circular area to the southeast of Tall Hisban. As with the simpler models, the third order models defined settlement patterns in the Hisban region as polar opposites.
Evaluating the Models
On the surface, it seems that a model based on known sites would provide the best insight into settlement patterns. After all it has sites and the model based on pottery does not, but it will be argued here that there are several factors which make the pottery model attractive. An examination of these factors must begin with the environment. The survey region can be divided into two major environmental zones. Stretching to the south and east are the large flat fields of the Madaba Plain, while to the north and west steep slopes descend to the Jordan Valley. In Figure 9 the digital elevation model, or DEM, of the project area can be seen straddling these two zones. The importance of this division between the plains and the slopes to the archaeology of the region cannot be overestimated.

Figure 9. Digital elevation model (DEM) of the Tall Hisban region

Figure 10. Third-order model based on known sites locations draped over the DEM of the Hisban region
Most importantly, the differences between trend surface models were closely related to the division of plain and slope. Figure 10 shows the third order model based on known sites locations draped over the DEM of the Hisban region. The areas of highest probability for this model are found in the wadi system to the northwest.

Figure 11. Third-order model based on pottery draped over the DEM of the Hisban region
Looking at modern settlement patterns, this assumption has much to commend it. Settlement is denser and population is obviously greater on the plain than in the wadis. Today, settlement in the wadis is almost exclusively individual houses, or farms. On the plain, settlement is characterized by villages and clusters of houses and farms. Logically this pattern makes sense. Construction, farming, communication, etc., are all more easily accomplished on the plain, and it seems a safe assumption that ancient humans would gravitate to the plain for the same reasons.
Although logical, this leaves unexplained the lack of ancient sites on the plain. Some sites lie buried beneath modern villages, but there are still large areas with no architectural remains. Once again, the environment may explain this situation. The large, flat fields of the plain to the southeast of Tall Hisban make it an ideal area for the cultivation of grain. Grain is most efficiently produced by mechanized farming. Modern farm machinery, especially combines, are at their best when the fields are large, the terrain is flat, and there is nothing to impede their progress. On the Madaba Plain, the first two of these conditions are natural and the third is easily accomplished with the aid of bulldozers. In these fields, boulders and other obstructions have been pushed to the edges of the fields. This clears all impediments to the movement of machinery, leaving behind a noticeable berm of soil, rocks, and boulders between fields. By this process, any archaeological structures that may have been in the field would be destroyed, appearing only as a line of stones along its edge.
Evidence to support this theory was provided by survey site 213. Located on the plain, the most obvious architectural feature at this site was a large rectilinear structure that straddled two grain fields. Approximately sixteen meters square with a foundation of large boulders, this structure had been bulldozed from two directions. In spite of this, in the area where the fields met, two corners and parts of three walls remained intact. If not for its placement on the boundary between fields, it is clear that this structure would have appeared as nothing more than a line of boulders. This site offered dramatic evidence for the ongoing destruction of archaeological material on the plain; destruction related to modern agricultural practices, and provided an explanation for the lack of architectural remains in an area where large quantities of pottery suggested a relatively dense population in antiquity.
Conclusions
Of the many conclusions that may be drawn from this data, three seem most important. First, while sites will continue to provide the best evidence for settlement patterns in most instances, other data can be used to fill in when architectural material is lacking. This is especially important in areas where modern agricultural practices have destroyed archaeological remains. Second, there is strong evidence that settlement was greater on the plains to the south and east of Tall Hisban than previously thought. In the past this region has been characterized as a marginal zone because there were so few recorded sites, but based on the evidence presented here, it can be argured that the majority of settlement in antiquity was located on this plain. Although it is impossible to prove this without architectural evidence, a strong case can be assembled using ceramics, modern settlement patterns and agricultural practices, and the evidence of sites like 213. Finally, this report illustrates the benefits of random sample survey. By forcing investigators into areas without obvious evidence of settlement, the random square survey allowed new lines of evidence for settlement patterns to be developed. Without the random square data, this new approach to settlement patterns would have been impossible, and settlement on the plain would continue to be under-reported.
End Notes
1 This report represents work over two field seasons. Investigators for the 1996 season were: Gary L. Christopherson, Tisha K. Entz, Erik LaBianca, Khalid Al-Arid, Brian Hopkins, Tim Gray, and Tina Higgins. Investigators for the 1997 season were: Gary L. Christopherson, Tisha K. Entz, Erik LaBianca, Tariq Hamdi, Eric Christopherson, and Richard Haglund. (Back)
2 A GPS uses signals from navigational satellites to calculate its position on the earth's surface. For the Hisban survey, a Magellan GPS 4000 XL was used. Uncorrected coordinates calculated by this hand held unit are accurate within 15 meters, when selective availability is off. (Back)
3 If the reader is not familiar with these spatial database systems, discussions can be found in many sources, including several with an archaeological emphasis (cf. Burrough, 1986; Christopherson, 1996; Kvamme, 1989; Kvamme, 1992). (Back)
References Cited
Boraas, R. S., & Geraty, L. T. (1976). The Fourth Campaign at Tell Hesban. Andrews University Seminary Studies, XIV(1), 1-15.
Boraas, R. S., & Geraty, L. T. (1978). The Fifth Campaign at Tell Hesban. Andrews University Seminary Studies, XVI(1), 1-17.
Boraas, R. S., & Horn, S. H. (1973). The Second Campaign at Tell Hesban. Andrews University Seminary Studies, XI(1), 1-16.
Boraas, R. S., & Horn, S. H. (1975). The Third Campaign at Tell Hesban. Andrews University Seminary Studies, XIII(2), 101-116.
Burrough, P. A. (1986). Principles of Geographical Information Systems for Land Resource Assessment. Oxford: Clarendon Press.
Christopherson, G. L. (1996). Computer Mapping. In E. M. Meyers (Ed.), Encyclopedia of Near Eastern Archaeology. New York: Oxford University Press.
Christopherson, G. L. (1997). The 1989 Random Square Survey in the Tall al-Umayri Region. In L. T. Geraty, L. G. Herr, Ø. S. LaBianca, R. W. Younker, & D. R. Clark (Eds.), Madaba Plains Project 3: The 1989 Season at Tell el-Umeiri and Vicinity and Subsequent Studies (pp. 250-290). Berrien Springs, Michigan: Andrews University/Institute of Archaeology.
Cole, J. A. (1989). Random Square Survey in the el-Umeiri Region. In L. T. Geraty, L. G. Herr, Ø. S. LaBianca, & R. W. Younker (Eds.), Madaba Plains Project 1: The 1984 Season at Tell el-Umeiri and Vicinity and Subsequent Studies (pp. 51-97). Berrien Springs, Michigan: Andrews University/Institute of Archaeology.
Computing Resource Center (1992). STATA. In Santa Monica: Computing Resource Center.
Davis, J. C. (1986). Statistics and Data Analysis in Geology. New York: John Wiley & Sons.
ESRI (1995). ARC/INFO. In Redlands, CA: Environmental Systems Research Institute.
Geraty, L. T. (1975). The 1974 Season of Excavations at Tell Hesban. Annual of the Department of Antiquities of Jordan, XX, 47-56.
Geraty, L. T. (1976). The 1976 Season of Excavations at Tell Hesban. Annual of the Department of Antiquities of Jordan, XXI, 41-53.
Geraty, L. T., & LaBianca, Ø. S. (1985). The Local Environment and Human Food Procuring Strategies in Jordan: The Case of Tell Hesban and its Surrounding Region. In A. Hadidi (Eds.), Studies in the History and Archaeology of Jordan II (pp. 323-330). Amman, Jordan: Department of Antiquities.
Herr, L. G., & Christopherson, G. L. (1998). Excavation Manual: Madaba Plains Project. Berrien Springs, MI: Andrews University/Institute of Archaeology.
Ibach, R. (1976). Archaeological Survey of the Hesban Region. Andrews University Seminary Studies, XIV(1), 119-126.
Ibach, R. (1978a). Expanded Archaeological Survey of the Hesban Region. Andrews University Seminary Studies, XVI(1), 201-213.
Ibach, R. (1978b). An Intensive Surface Survey at Jalul. Andrews University Seminary Studies, XVI(1), 215-222.
Ibach, R. D. (1987). Archaeological Survey of the Hesban Region: Catalogue of Sites and Characterization of Periods. Berrien Springs, Michigan: Andrews University/Institute of Archaeology.
Kvamme, K. L. (1989). Geographic Information Systems in Regional Archaeological Research and Data Management. In M. B. Schiffer (Eds.), Archaeological Method and Theory (pp. 139-203). Tucson: University of Arizona Press.
Kvamme, K. L. (1992). Geographic Information Systems and Archaeology. In G. Lock & J. Moffett (Eds.), Computer Applications and Quantitative Methods in Archaeology 1991 (pp. 77-84). Oxford: TEMPVS REPARATVM Archaeological and Historical Associates Limited.
LaBianca, Ø. S. (1984). Objectives, Procedures, and Findings of Ethnoarchaeological Research in the Vicinity of Hesban, in Jordan. Annual of the Department of Antiquities of Jordan, 28 (268-287).
LaBianca, Ø. S. (1990). Sedentarization and Nomadization: Food System Cycles at Hesban and Vicinity in Transjordan. Berrien Springs, Michigan: Andrews University/Institute of Archaeology.
LaBianca, Ø. S., & Lacelle, L. (Ed.). (1986). Environmental Foundations. Berrien Springs, Michigan: Andrews University/Institute of Archaeology.
Monroe, C. B., Feder, K. L., Foirier, D. A., & Gradie, R. R. (1980). Trend Surface Analysis: The Settlement Dynamics of Colonial Connecticut. Man in the Northeast, 19, 105-128.
About the Author
Gary L. Christopherson is a Ph.D. candidate in the Near East Studies Department, and a Research Assistant in the Advanced Resource Technology Group at The University of Arizona. He has been associated with the Madaba Plains Project since 1987, where he is a Field Director in charge of archaeological survey. Correspondence may be sent to: ART Group (SRNR), 203 Biological Sciences East, The University of Arizona, Tucson, AZ, 85721, phone (520) 621-3045, or by email: Gary Christopherson -- garych@nexus.srnr.arizona.edu
|
 Geo-Archaeological Information Applications Lab 979 E. Divot Drive Tempe, AZ 85283 Webmaster - shsavage@asu.edu |

|

|
|
|

|