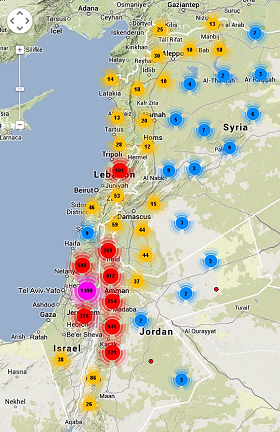
The Digital Archaeological Atlas of the Holy Land (DAAHL) is a signature project of the GAIA Lab, in partnership with the Center for the Study of Art, Architecture, and Archaeology (CISA3) at the Qualcomm Institute at UCSD. The DAAHL project is the initial node of the Mediterranean Archaeological Network (MedArchNet), and it's a sponsored project of the American Schools of Oriental Research (ASOR). The DAAHL web site combines an extensive database of archaeological sites and commentary with cutting-edge Google Earth and Google Maps web mapping APIs, and visualiztion tools to create a content-rich user experience.
True color Landsat 7images have been pansharpened to 14.25 meter resolution. The images available here have been processed from large mosaic tiles into one-degree blocks by the GAIA Lab. The mosaiced images were obtained from the NASA/JPL website as red, green, and blue bands of 28 meter resolution, and the pan-sharpened band at 14 meter resolution. These were combined into a single, pan-sharpened, "true" color image, which was then cut into slightly overlapping, one-degree tiles, using Global Mapper. The combination of the Landsat RGB bands produces an approximation of true color, but it is too red to represent the Earth's surface accurately. The images were further processed in Photoshop to enhance contrast and more closely approximate true color. Each image is downloadable in a .zip file. Imagery from Afghanistan, Egypt, Greece, Iran, Iraq, Italy, Libya, Morocco, Saudi Arabia, the southern Levant, Syria and Lebanon, Tunesia, and Turkey has been processed. The download page provides more detail on how the images were manipulated.
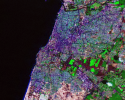
False color Landsat 5 images (28m resolution) were processed from MrSid files into .tif format, WGS84, one degree tiles. They are available for the southern Levant. The bands represented are: Band 7 (near infrared) is shown as red, band 4 is shown as green, and band 2 is shown as blue. This combination provides a "natural-like" rendition, while also penetrating atmospheric particles and smoke. Healthy vegetation will be a bright green and can saturate in seasons of heavy growth, grasslands will appear green, pink areas represent barren soil, oranges and browns represent sparsely vegetated areas. Dry vegetation will be orange and water will be blue. Sands, soils and minerals are highlighted in a multitude of colors. This band combination provides striking imagery for desert regions. It is useful for geological, agricultural and wetland studies. If there were any fires in this image they would appear red. This combination is used in the fire management applications for post-fire analysis of burned and non burned forested areas. Urban areas appear in varying shades of magenta. Grasslands appear as light green. The light-green spots inside the city indicate grassy land cover - parks, cemeteries, golf courses. Olive-green to bright-green hues normally indicate forested areas with coniferous forest being darker green than deciduous.
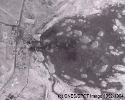
Georeferenced Corona Images are intelligence imagery acquired by the first generation of United States photo-reconnaissance satellites. They were declassified by President Clinton through an Executive Order signed on 24 February 1995. CORONA images were shot on long rolls of 5" wide panchromatic film. Following their declassification they were scanned by the U.S.G.S. and made avaialble in their raw (non-georeferenced form) via the U.S.G.S. website. The CORONA tiles you can download here have been processed from the raw images into geotiff tiles, resulting in square images, 10,621 pixels on each side . The imagery is georeferenced in decimal degrees of Latitude/Longitude using the WGS84 datum. Since the satellite did not cross the equator at 90 degrees, its path was angled relative to any longitude line, resulting in imagery that contains small wedges in some tiles. All the Corona tiles have white backgrounds.
The Mediterranean Archaeological Network (MedArchNet) is envisioned as a series of linked archaeological information nodes, each of which contains a regional database of archaeological sites that share a common database structure in order to facilitate rapid query and information retrieval and display within and across nodes in the network. The MedArchNet button takes you to the main MedArchNet web site on the DAAHL server.
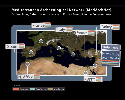
The
MedArchNet Prototype displays archaeological sites in a Google Maps powered prototype application, which were derived from the Geographic Place Names Gazettes for the countries surrounding the Mediterranean Sea. The site locations are not especially accurate, and there is no temporal information associated with them. The data presented here include the main site name and any alternate names, plus a site type designation.
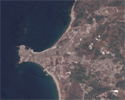
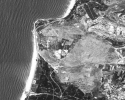
NIMA/SPOT images from the southern Levant can be downloaded here, as a series of 39 tiles in the region from 35 N, 34 E (northwest corner) to 29 N, 40 E (southeast corner) that contains Jordan and Israel, and parts of their neighbors. Most tiles cover an area that is one degree east-west (a few are 1.1 degrees) and one half degree north-south. The images are from the DOI-10M - National Imagery and Mapping Agency, and contain data that is copyrighted, (C) CNES/SPOT Image 1992-1994, but their use is unrestricted. They are in WGS84 (lat/lon) projection.
Digital Chart of the World (DCW) Data are 1:1,000,000 scale coverage shapefiles. The DCW data include topography (hypsography), populated places, land use/land cover, transportation, drainages, cultural places, utility lines, and airports. It was originally created by the Defense Mapping Agency from aeronautical charts. The data you can download below are from the 1993 edition. they have been procedd into datasets by country, rather than as the 5 degree tiles originally provided by ESRI.
The
ReProjectME! Program was written to make the process of reprojecting ArcView shapefiles easier to accomplish than in the ArcView Projection Utility Wizard or by using the Projector extension that also ships with ArcView. The appropriate projection systems for the Near East were not always included in every version of ArcView. The program supports conversion of ArcView shapefiles, ArcInfo coverages and coordinate lists in eight different ASCII text configurations; and it supports reprojection of individual points. It supports about 30 different map projections commonly used in the Middle East.
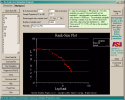
The
RankSize program lets the user create rans-size plots of archaeological sites and estimate the probability that an observed rank-size site distribution could be drawn as a random sample from a universe of sites that conform to the rank-size rule. It uses a monte-Carlo simulation approach and the Kolomogorov-Smirnoff test to make the estimates. The program was designed for 32-bit, Windows XP computers, but it should run in XP mode on Windows 7 computers.